HOW TO USE PLANTVIZ
To use the PlantViz, click on the PlantViz tab.
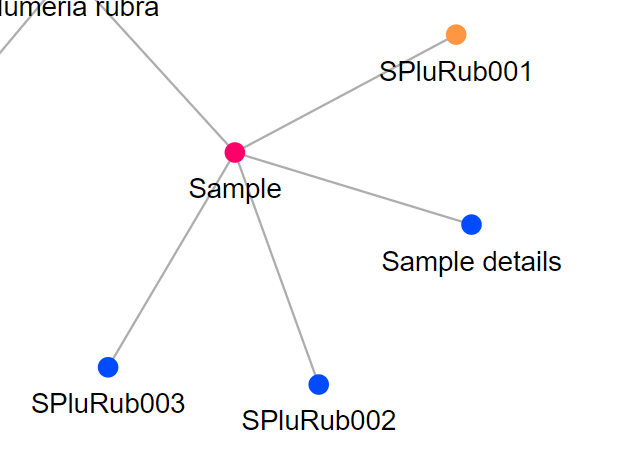
PlantViz provides a graphical user interface that enable users to query the POUM and a graphical viewer to display the results of the query in a form of network graph.
The relationships between the data were shown in visualisation form that enables the users to infer the knowledge and correlation between the data easily.

Searching in PlantViz
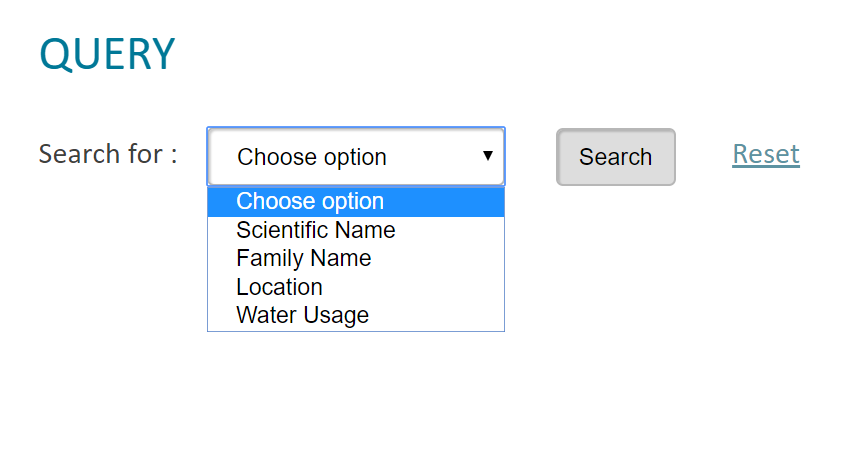
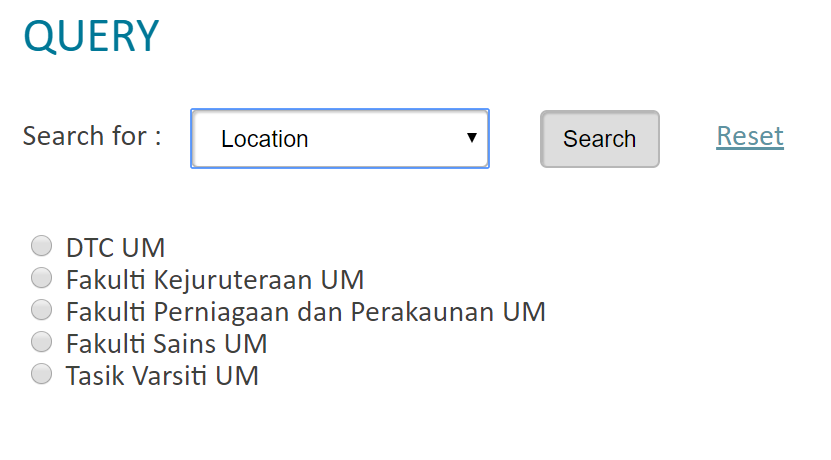
Searching in PlantViz is based on the four query parameter options which are 'Scientific Name', 'Family Name', 'Location', and 'Water Usage' (see Fig 2).
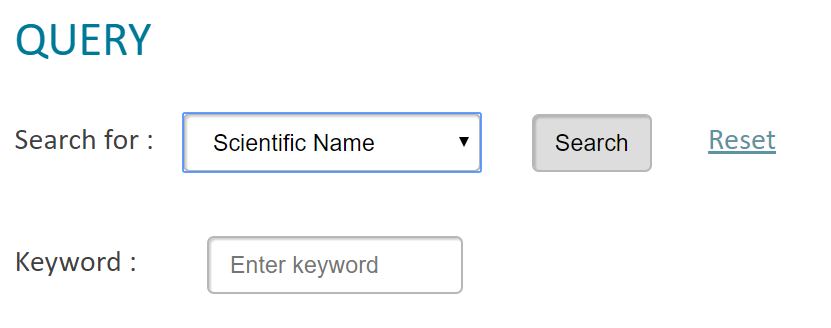
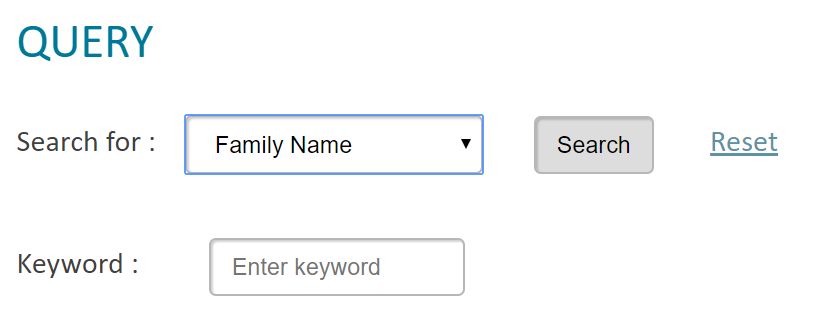
- To start, users are required to select one of these query options at a time. Once the option is selected, users are required to key in a keyword (see Fig 2) or select relevant parameter from the given options in drop down list.
- Scientific Name
- The keyword must start with an uppercase letter for the genus name. Example: "Ixora javanica"
- Words must be separated with a single space. Example: "Lawsonia<space>inermis"
- NO extra space at the beginning or at the end of keyword.
- Family Name
- The keyword must start with an uppercase letter for the genus name. Example: "Acanthaceae"
- NO extra space at the beginning or at the end of keyword.
- Location
- Select ONLY ONE from the given options.
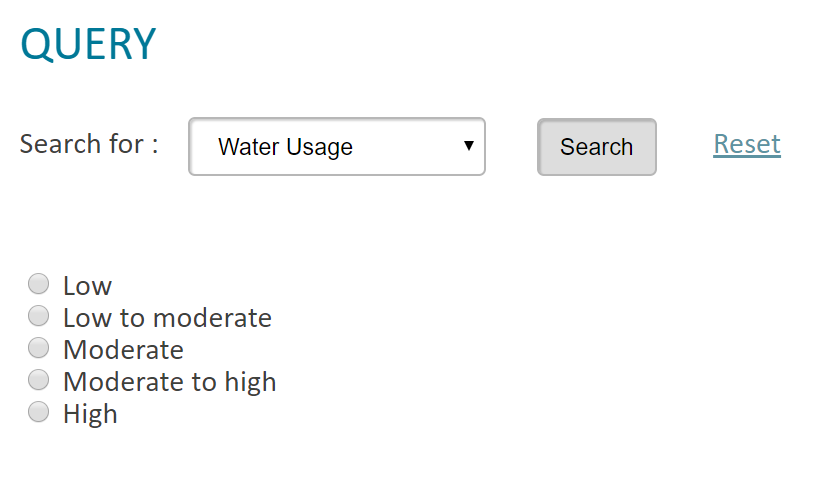
- Water Usage
- Select ONLY ONE from the given options.
- Once the query parameter option is selected and keyword is entered, or an option in drop down list is selected, click on the Search button to start the searching.
- To start over, click on the Reset button.
- Please do not click on Back button to start a new query for searching.
Visualization Features
PlantViz presents the retrieved result of a query in a graphical form to allow user to see the relationships between the data instead of reading it. Users are able to interact directly with the presented data by using the visualization features provided in PlantViz as well as basic features which include zoom in, zoom out, and draggable.
i. View the label of the nodes
The purpose of this feature is to allow user to view the label of the nodes.
- Hover the cursor on the • node.
- Hold the cursor until the label on the node is appeared.
- If the label does not appear, click on the • node and hover it again.
Note: The other nodes may also have labels
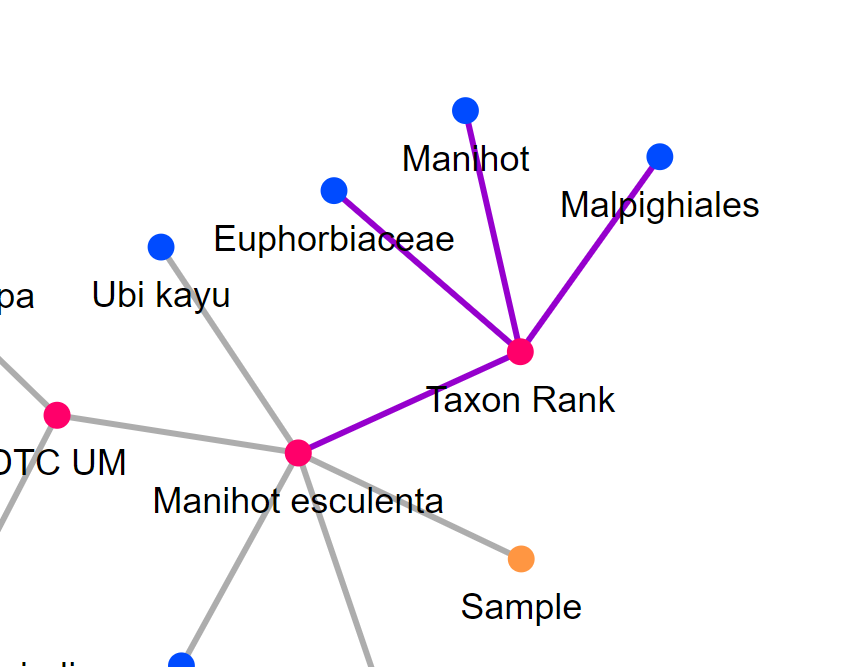
- Highlight the nodes
The purpose of this feature is to show relationships between the data.
- Hover the cursor on any node
- The links that connected the nodes will be highlighted in purple colour
3. Expand and shrink the network graph
The purpose of this feature is to avoid cluttered nodes in the network graph. It also helps users to focus on a part of the presented data.
- To expand or shrink the network graph, double click on the • node
- To shrink the graph, double click on the • node
4. View the thumbnail images of plant sample
The purpose of this feature is to view the thumbnail image(s) of some plant sample(s).
- Hover the cursor on the node with the sample ID.
- A popup with thumbnail image(s) will be appeared.
5. View the full information of plant image
The purpose of this feature is to view full information of selected plant samples.
- Hover the cursor on Sample node.
- Click on the Sample details node and users will be directed to a new page containing full information of the selected plant sample.